Compare ← All countries

Compare Tuvalu and United States side by side

Tuvalu flag Tuvalu Oceania
United States flag United States North America
Key Statistics
Population
people
9.6K
218th
340.1M
3rd
GDP
gross domestic product, US$
$62.3M
215th
$28.8T
1st
GDP per Capita
US$ per person
$6,345
128th
$84,534
12th
GNI per Capita (PPP)
international $
$8,320
145th
$85,980
10th
GDP Growth
annual %
3.9% 81st
2.8% 122nd
Surface Area
km²
30 km²
215th
9,831,510 km²
3rd
Population Density
people per km²
321.5 /km²
34.6 /km²
Fertility Rate
births per woman
3.2 52nd
1.6 135th
Urban Population
% of population
64.7% 106th
80.1% 57th
Population 65+
% of population
6.7% 127th
17.9% 45th
Health
Life Expectancy
years at birth
67.1 yrs
175th
78.4 yrs
63rd
Infant Mortality
per 1,000 live births
17.1 120th
5.5 56th
Maternal Mortality
per 100,000 live births
170.0 150th
17.0 67th
Health Spending per Capita
US$
$1,724
47th
$13,473
1st
Health Spending
% of GDP
27.1% 1st
16.7% 3rd
Physicians
per 1,000 people
1.35
113th
3.68
39th
Hospital Beds
per 1,000 people
4.16
39th
2.68
82nd
Population Pyramidsby age & sex, 2024
Tuvalu
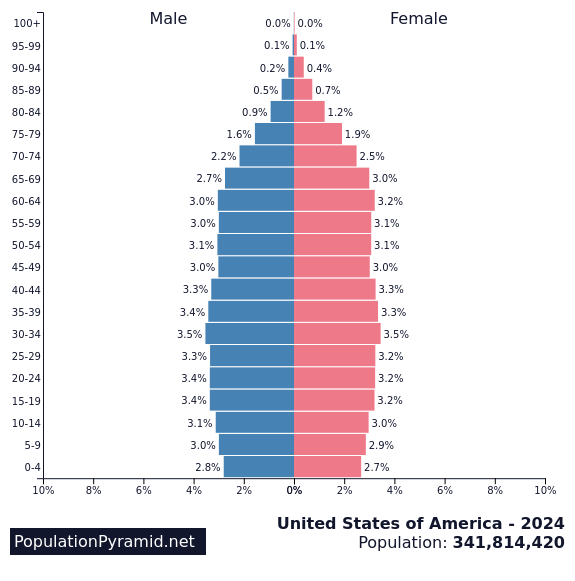
United States
Economy & Environment
Unemployment Rate
% of labour force
N/A
4.0% 71st
GHG Emissions
tons per capita
2.29 36th
17.74 175th
Agriculture
% of GDP
15.9%
1.0%
Industry
% of GDP
7.0%
17.9%
Services
% of GDP
N/A
77.6%
Exports
% of GDP
N/A
11.1%
Imports
% of GDP
N/A
14.3%
Education & Society
Literacy Rate
% of adults
100.0% 4th
N/A
Education Spending
% of GDP
12.8% 3rd
5.4% 44th
Gini Index
0 = perfect equality
39.1 115th
41.8 134th
Poverty Rate
at $2.15/day
9.0% 110th
1.2% 68th
Homicide Rate
per 100,000 people
18.3 173rd
5.8 134th
Women in Parliament
% of seats
0.0% 192nd
28.7% 76th
Female Labor Participation
% of female population
N/A
56.6% 73rd
Military Spending
% of GDP
N/A
3.4% 24th
Technology & Infrastructure
Internet Users
% of population
74.3%
123rd
93.1%
42nd
Mobile Subscriptions
per 100 people
98.9 143rd
112.4 111th
Access to Electricity
% of population
100.0%
120th
100.0%
124th
Access to Water
% of population
98.7%
91st
100.0%
44th
Access to Sanitation
% of population
89.7%
128th
99.6%
34th
Renewable Energy
% of consumption
5.2% 167th
10.9% 143rd
Forest Area
% of land area
33.3% 99th
33.9% 96th
Ochre marks the leading country for each measure.

GDP Compositionagriculture · industry · services
Tuvalu
United States
Trade Balanceexports vs imports, % of GDP
Tuvalu
United States
Population Over Time1960 – 2024
Tuvalu
United States
GDP Over Time1960 – 2024, US$
Tuvalu
United States
Life Expectancy Over Time1960 – 2024
Tuvalu
United States